This post explores the use of Linux’ ptrace functionality to step through a complete program execution instruction by instruction, and compares it to a much faster hack involving setting the x86 trap-flag and signal-handlers, which allows observing the execution of a program from within that program.
For some x86 assembler project I wanted to step through the execution of complete programs in order to record the use of every single instruction that it uses. I knew that GDB (the Gnu Debugger) allows stepping through a program instruction by instruction, and a little exploration reveals that the easiest way to script/automate it is to use the Linux functionality upon which GDB is built: ptrace.
Stepping through a program using ptrace
There’s this great tutorial by Eli Bendersky, which shows how to use ptrace to write a debugger. Basically it involves forking the current process. The resulting child process becomes the debuggee and the parent becomes the debugger.
The debuggee must tell Linux to allow tracing it, then will execute
execve
to replace its process with the program you want to debug. The debuggee
will stop at the execve and send a signal to the debugger that
allows it to take control of the process.
Meanwhile, the debugger must wait for the child to suspend
execution. It can then use Linux’ ptrace functions to observe the
debuggee or tell it to continue executing, either normally
(PTRACE_CONT), until the next syscall (PTRACE_SYSCALL), or for a
single machine instruction (PTRACE_SINGLESTEP).
It kind of looks like this:
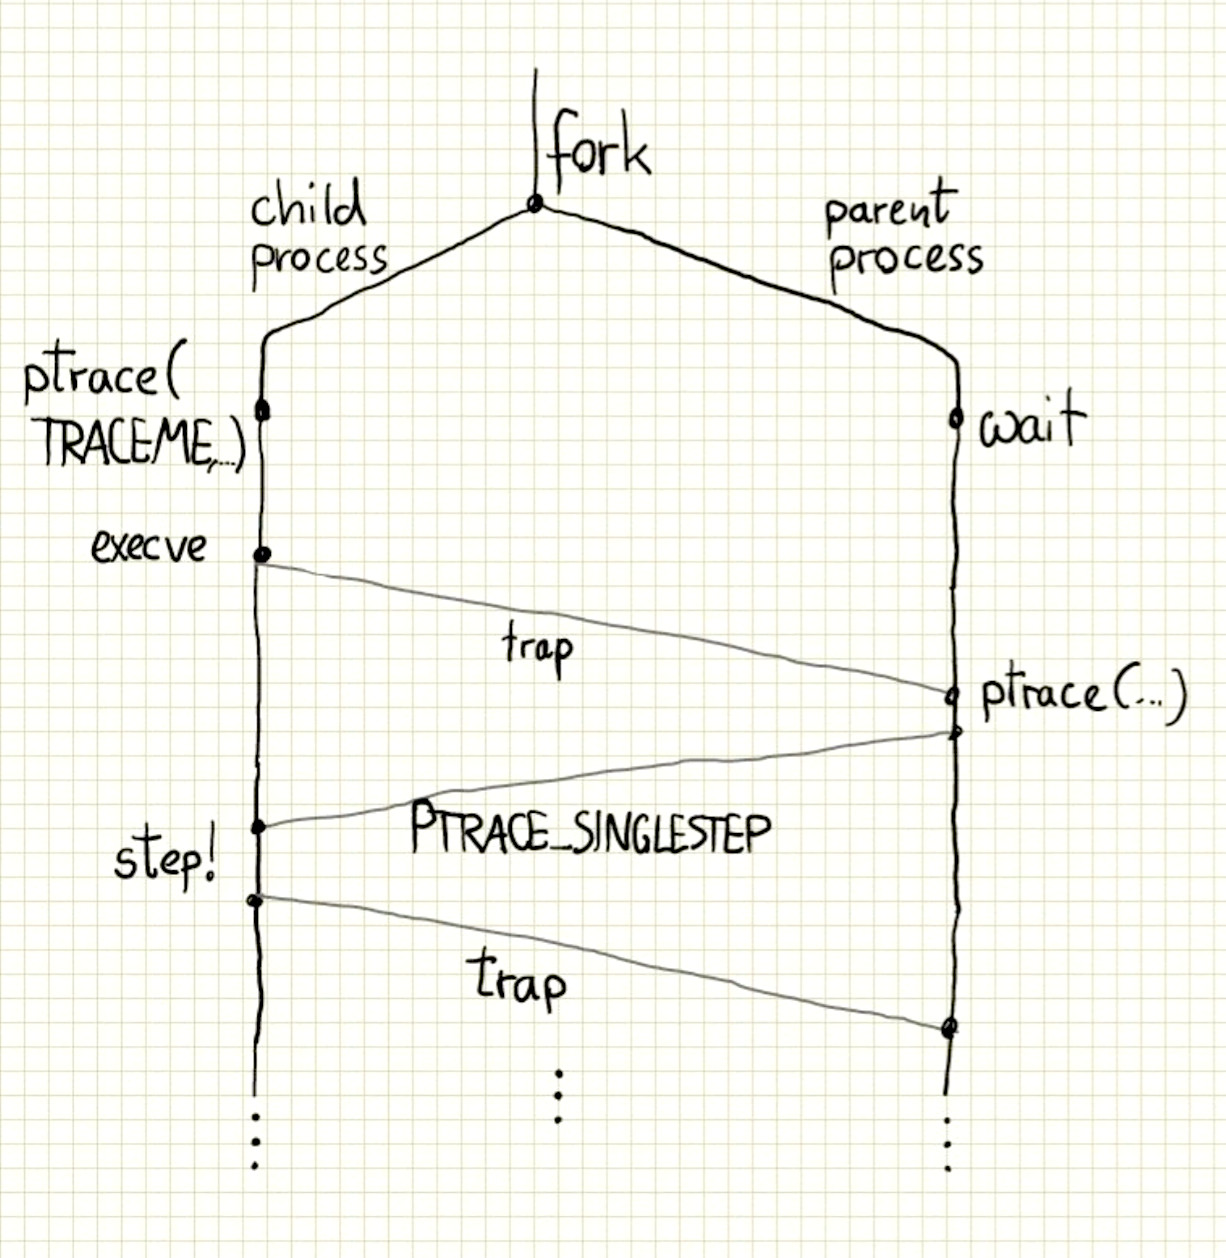
This functionality is what GDB is built on, and it’s also what strace uses, by executing from one system call to the next.
Let’s build a simple test example to see how fast we can execute a program.
To set this up, our main program has to fork to create the debugger
and debuggee:
int main(int arc, char* argv[]) {
    pid_t  child_pid;

    child_pid = fork();
    if (child_pid == 0) {
        run_target();
    } else if (child_pid > 0) {
        run_debugger(child_pid);
    } else {
        return -1; // error
    }
    return 0;
}
The debuggee has to tell the operating system it wants to be ptraced, and then it has to execute some program.
void run_target() {
  printf("run target\n");

  // allow tracing this process
  if (ptrace(PTRACE_TRACEME, 0, 0, 0) < 0) {
    perror("ptrace"); return;
  }

  // to trace arbitrary program, use execve
  // but we just use trap instruction to start ptrace...
  asm("int3\n" : : );

  // ...to execute the loop within the same program
  loop(1*1000*1000);
}
We don’t use execve (which would trigger the ptrace functionality),
because we’re just executing a function. We can trigger the debugger
explicitly by executing a debug exception instruction (int3 in x86).
This will cause a trap interrupt that will halt the program and send
the signal to the parent process.
Note I’m using gcc’s inline assembly function, which allows putting assembly instructions directly in code. This tutorial explains it in detail.
In our case, the function we’re debugging is pretty trivial. We just want to know how many instructions we can step through per second, so we’ll use a simple function that runs for approximately the given number of cycles, ensured by running a trivial assembler loop that takes two instructions.
// loop for approximately total_num_instructions instructions
void loop(unsigned int total_num_instructions) {
  // the loop body executes 2 instructions
  unsigned int count = total_num_instructions >> 1;
  asm volatile(
      "1:\n" // define local label
      "decl %%eax\n" // eax -= 1
      "jnz 1b\n" // jump to previous local label 1 (before) if not zero
      : // no output regs
      : "a"(count) // input count -> eax
      );
}
Meanwhile, the debugger has to wait for the signal from the debuggee
process, and once the signal it’s received it can take control via the
ptrace functionality. In this case, we want to step through the
program, each time waiting for the next instruction to complete, while
counting the number of instructions that get executed.
void run_debugger(pid_t child_pid) {
  int wait_status;
  long long int num_instructions = 0;
  printf("debugger started\n");

  // wait for child to stop in its first instruction
  wait(&wait_status);

  while (WIFSTOPPED(wait_status)) {
    num_instructions++;
    // make child execute another instruction
    if (ptrace(PTRACE_SINGLESTEP, child_pid, 0, 0) < 0) {
      perror("ptrace"); return;
    }

    // wait for child to stop in its next instruction
    wait(&wait_status);
  }

  printf("the child executed %lld instructions\n", num_instructions);
}
It turns out this way of stepping through a program is pretty slow We can only execute 16,200 instructions per second, on a 1.6Ghz machine — that’s a 100,000x slowdown. So a program that would take 1s to execute normally will take 28 hours to step through with the debugger. Ouch.
I’m not quite sure why this is so slow, but I believe it has to do with the way this scheme uses inter-process-communication, with two processes waiting and talking to each other. There are context switches for every step, and the scheduler is involved as well. There’s a lot of overhead.
So the question is, is there way to do it faster. Yes there is.
Stepping through a program using trap-flags and signal handlers
When thinking about this problem, I thought a way to make this faster is to try to stay within the same process. I remembered that linux has something called “signal handlers”, functions that can be associated with linux signals, to intercept signals and handle them directly. For example it is possible for a process to intercept bad memory accesses (seg faults), or to intercept stop/kill signals and perform some action that either fixes the problem or performs some cleanup before the process gets killed.
It turns out that it is possible to register a signal handler to intercept the debugging signals, called traps. It’s called SIGTRAP.
Now we just need a way to cause traps at every instruction. One way would be
to modify the code that is currently being executed, within the trap signal handler,
to always replace the next instruction with int3. That sounds like a lot of work.
Another way is to set the trap flag of the x86 status register. When set, it will cause a debugging interrupt after the execution of every single instruction.
The execution of our program would look something like this:
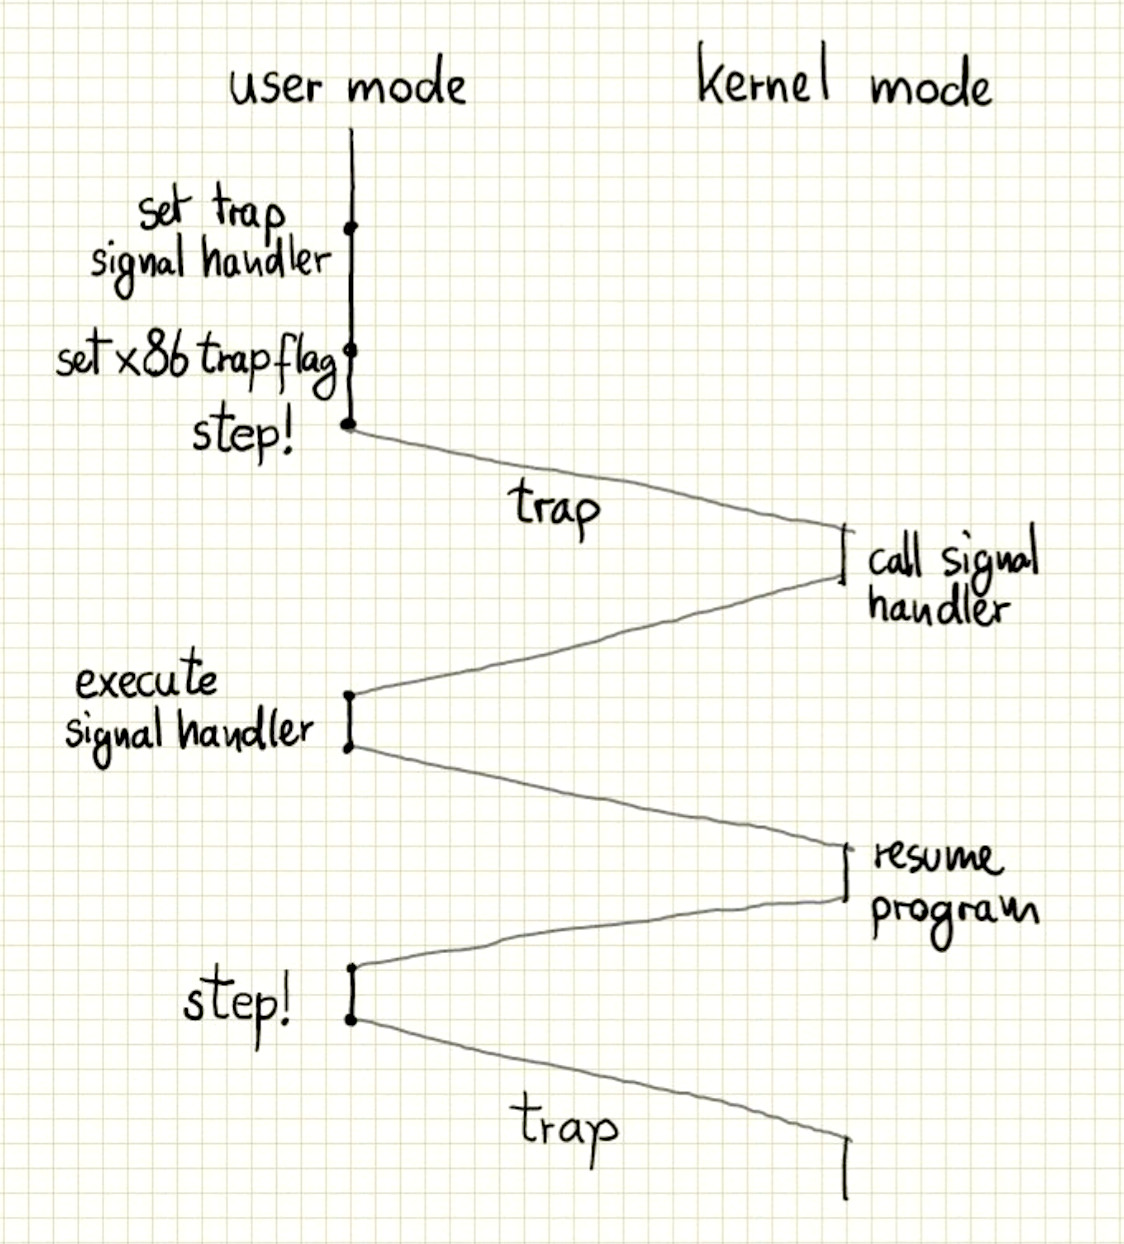
Note that instead of having the execution flow between different processes, it only switches back and forth between kernel and user mode. So hopefully this is much faster.
The question is, does this actually work?
Well, let’s try it. First lets create a signal handler that will be executed every time. That’s our debugger. Again it will count the number of instructions:
static long long int num_instructions = 0;
/** trap handler executes for every instruction -- simply counts cycles */
void trapHandler(int signo, siginfo_t *info, void *context) {
  num_instructions++;
}
We also need a way to set/reset the trap flag, we’ll use assembler again:
void setTrapFlag() {
  asm volatile("pushfl\n" // push status register to stack
               "orl $0x100, (%esp)\n" // set trap-flag of on-stack value
               "popfl\n" // pop status register
               );
}

void clearTrapFlag() {
  asm volatile("pushfl\n" // push status register
               "andl $0xfffffeff, (%esp)\n" // clear trap-flag
               "popfl\n" // pop status register
               );
}
In order to start and stop tracing a program, we’ll register the signal handler, and set/reset the trap flag. The stop tracing functions will also print out how many instructions were executed.
struct sigaction trapSa;
void startTrace() {
  // set up trap signal handler
  trapSa.sa_flags = SA_SIGINFO;
  trapSa.sa_sigaction = trapHandler;
  sigaction(SIGTRAP, &trapSa, NULL);

  // set trap flag
  setTrapFlag();
}


void stopTrace() {
  clearTrapFlag();

  printf("num instructions: %lld\n", num_instructions);
}
Our overall program will start the tracing, again run our “loop” function,
and stop the tracing.
int main(int argc, const char* argv[]) {
  startTrace();
  loop(10*1000*1000);
  stopTrace();
}
This actually works. At least on my 32-bit 1.66 GHz Atom N450 netbook.
When executing, it tells me that 10,000,030 instructions were executed.
Performance Results
It turns out this hack is also much faster than using ptrace. The ten million instructions are getting executed within 38 seconds or so, meaning a slowdown of only about 6000 using trapflag-tracing.
ptrace-tracing |
trapflag-tracing |
original |
|
|---|---|---|---|
| num instructions | 1e6 |
1e7 |
1e9 |
| execution time | 61.7s |
38.1s |
0.61s |
| slowdown | 101,072x |
6,244x |
1.0x |
| instructions/s | 16 KHz |
262 KHz |
1.64 GHz |
Our tapflag + signal-handler hack is more than ten times faster than
ptrace. This means 1s of original execution time will “merely” take
100 minutes — a bit more than an hour, instead of a bit more than a
day. This definitely should make it possible to record statistics, at
least about simple programs.
One issue is that a debugger is not very useful if it has to be inserted into the source code of the program that you want to observe. So next I will explore possibilities to inject this kind of debugging into an arbitrary, already compiled program.
See the code in the github repository.